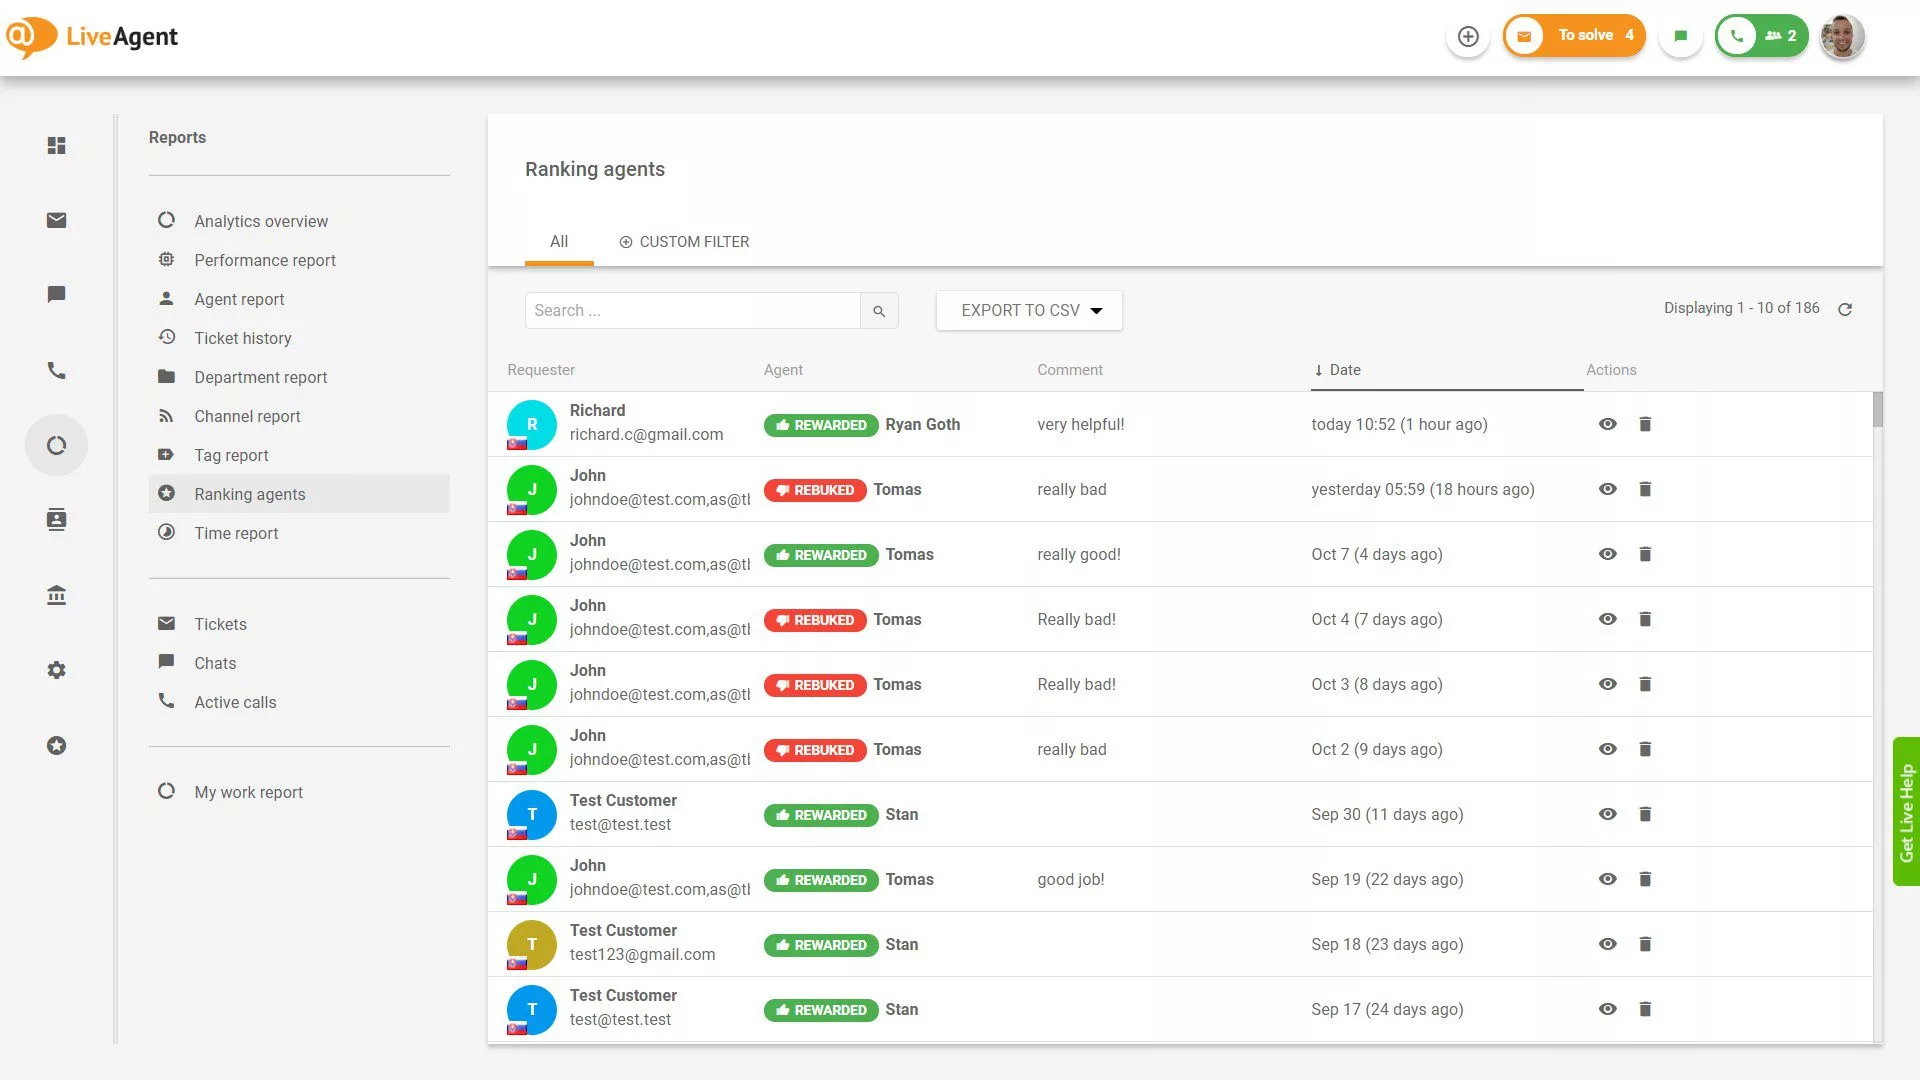
A customer satisfaction survey turns a customer’s feeling about a conversation into a number the team can follow week by week. The result is usually reported as CSAT, the customer satisfaction score; teams also call the single question a customer satisfaction rating or customer service rating, and the answers customer service feedback.
How do you calculate CSAT?
To calculate CSAT, divide the number of satisfied responses by all responses and multiply by 100; on a 1–5 scale, only answers of 4 and 5 count as satisfied.
Customer satisfaction score
On a good/bad scale, divide the good ratings by all ratings. Customers who do not answer are left out of both numbers.
Example: In one month 240 customers answer the survey after their ticket is solved. 190 choose 4 or 5 on a 1–5 scale: 190 ÷ 240 × 100 = 79%.
Benchmark: 79.4% is the median ticket CSAT across 1.1 billion tickets of Freshdesk customers in 2021. Source: Freshdesk Customer Service Benchmark Report 2022 (vendor dataset), p. 8
What is a good CSAT score?
A good CSAT score for customer support is around 80%: published datasets from help desk vendors put the median for tickets and the average for live chat just under that level.
| Dataset | CSAT |
|---|---|
| Tickets, median, 1.1 billion tickets (Freshdesk, 2021) | 79.4% |
| Live chat, 220 million chats (Comm100, 2024) | 79.9% |
Sources: Freshdesk Customer Service Benchmark Report 2022, Comm100 Live Chat Benchmark Report 2025. Both are vendors’ datasets of their own customers. Compare yourself with your own trend first: a scale or a question that differs from theirs changes the number.
What questions should a customer satisfaction survey ask?
A customer satisfaction survey after a support conversation should ask one rating question and offer an optional comment, such as “How satisfied are you with the help you received?” on a 1–5 scale. Common question types:
- Rating: a scale from 1 to 5, stars or faces. Easy to answer and easy to turn into a score.
- Yes or no: “Did we solve your problem?” Useful next to the rating, and close to first call resolution.
- Open comment: “What could we have done better?” The comments explain the scores.
- Multiple choice: “What was the main reason for your rating?” Helps group the comments by topic.
Customer satisfaction survey question examples
- How satisfied are you with the help you received today?
- Did we solve your problem?
- How easy was it to get your issue solved? (CES)
- How would you rate the speed of our reply?
- Did the agent understand your question?
- Was the answer clear and complete?
- How likely are you to contact us again for help?
- What is one thing we could have done better?
- Is there anything else we should know?
More ready-made questions: customer satisfaction survey questions.
Which scale should a CSAT survey use?
Most support teams use a 1–5 scale and count 4 and 5 as satisfied; shorter scales such as yes/no or three points get more answers but show less about how satisfied people are.
| Scale | Counted as satisfied | Best for |
|---|---|---|
| 1–5 numbers or stars | 4 and 5 | Following a detailed trend |
| Three points (No, OK, Yes) | Yes, and OK if you decide so | A quick rating right after a chat |
| Yes or no, thumbs up or down | Yes | The most answers, the least detail |
| Faces | The two happiest faces | Phones and in-person feedback |
How is CSAT different from NPS and CES?
CSAT measures satisfaction with one interaction, NPS measures how likely customers are to recommend the company, and CES measures how easy it was to get the issue solved:
| Metric | Question | How it is scored | What it shows |
|---|---|---|---|
| CSAT (customer satisfaction score) | “How satisfied are you with the help you received?” | 1–5; the share of 4s and 5s | How one conversation went |
| NPS (Net Promoter Score) | “How likely are you to recommend us to a friend?” | 0–10; % of 9–10 minus % of 0–6, from −100 to +100 | Loyalty to the company as a whole |
| CES (customer effort score) | “How easy was it to get your issue solved?” | Usually 1–7; the average, higher means easier | How much work the customer had to do |
Support teams usually start with CSAT, because it points at specific conversations, agents and topics.
Which customer satisfaction metrics should a support team track?
Most support teams track CSAT next to resolution time and first call resolution, and ask NPS or CES a few times a year: CSAT shows how customers felt, the other metrics show why.
| Metric | What it tells you | How often to look |
|---|---|---|
| CSAT | How satisfied customers were with a conversation | Every week |
| First call resolution | How often issues are solved in the first contact | Every week |
| Resolution time | How long customers wait for a solution | Every week |
| First response time | How long customers wait for the first reply | Every day |
| NPS and CES | How loyal customers are and how easy support feels | A few times a year |
How do you run a CSAT survey in a small support team?
A small team can run a CSAT survey with one question sent automatically after every solved ticket or chat, and a short weekly review of the low ratings.
-
Pick one question and one scale
Decide how you ask and which answers count as satisfied, and keep both fixed so the numbers stay comparable.
-
Ask right after the conversation
Send the question when the chat ends or the ticket is solved, in the same channel the customer used.
-
Read the low ratings every week
Open each poor rating, read the comment and the conversation, and note the cause: a slow reply, a wrong answer, a policy the customer disliked.
Fix the pattern, then thank the team
Change the answer, the process or the routing behind repeated complaints, and share the good comments with the agents who earned them.
What are common customer satisfaction survey mistakes?
The most common mistake is asking too much: long surveys get fewer answers, and the few people who answer are often the very happy or the very unhappy.
- Changing the scale or the question. The score is only comparable with itself when both stay the same.
- Counting scores without reading comments. The number shows that something is wrong; the comments show what.
- Surveying too late. A survey days after the conversation measures the customer’s mood, not the support.
- Blaming agents for policies. A customer unhappy with a price or a rule rates the agent low; separate those ratings before you judge people.
Customer satisfaction ratings in LiveAgent