7 call center problems hiding in your metrics (and how to fix each one)
High AHT, low FCR, rising abandon rate - your call center metrics are telling you something. Here are 7 common problems they reveal and the fixes that actually work.
Published on Jun 5, 2026.Last modified on Jun 5, 2026 at 12:00 am
Your AHT went up. Your CSAT stayed flat. Your abandon rate is creeping higher. These numbers are symptoms, not the diagnosis. This article maps the seven most common call center problems to the metrics that reveal them, and walks through the fix for each one. For context on what these numbers should look like in your sector, see the call center benchmarks 2026.
How to read your metrics as a diagnostic, not a report card
Most teams treat metrics as a scorecard: green is good, red is bad. That framing produces the wrong response. A metric in the red tells you something went wrong. It does not tell you what, where, or why.
The better framing is diagnostic. AHT above benchmark means a call is taking longer than expected. The question is: which part? Is it verification? Knowledge gaps? System navigation? Escalation delays? Each cause has a different fix. Treating a high AHT as a single problem produces a generic solution that fixes nothing.
Each problem below follows a four-part structure: the metric symptom, the most common root causes, the concrete fix, and how to confirm the fix is working. Use it as a diagnostic checklist, not a reading list.
Problem 1: AHT is above benchmark: 4 root causes and fixes
Symptom:
Average handle time consistently above your industry benchmark (see call center statistics for reference ranges). Not a one-week spike: a sustained elevation over 4 to 6 weeks.
Root causes and fixes:
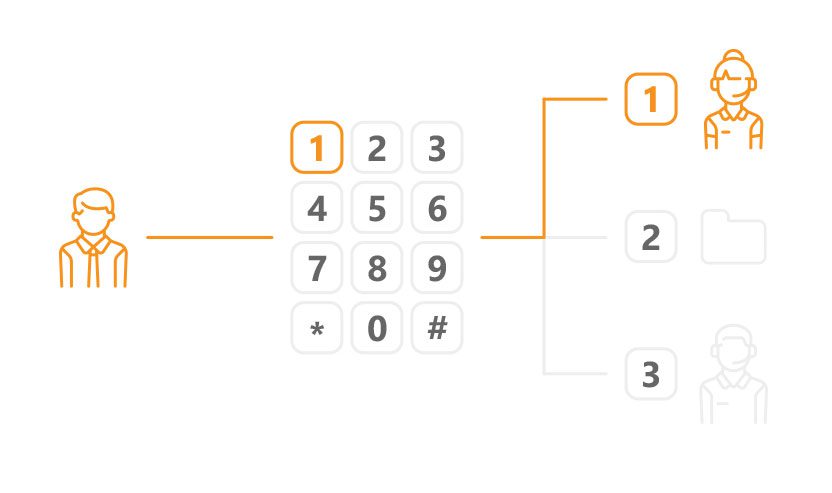
Complex or poorly structured IVR routes callers to the wrong agent, who spends time transferring or gathering basic information. Fix: audit your IVR flow. Track transfer rate by IVR path. Restructure the paths with the highest transfer rates.
Agents lack a knowledge base and search manually or ask colleagues. Fix: build or clean up your knowledge base. Measure resolution time before and after for the same query types.
Routing sends general queries to senior agents and escalations to junior agents. Fix: implement skills-based routing. Match query complexity to agent tier.
Agent training is inconsistent. New cohorts handle calls differently from experienced agents. Fix: compare AHT by agent tenure. If new agents are 40%+ above average, the problem is onboarding, not process. AI features for agent assist can reduce this gap.
How to verify the fix:
Pull AHT by IVR path, by agent, and by query type separately. A global improvement in average AHT confirms the fix is working. A stable average with one segment still high means the root cause in that segment is unresolved.
Problem 2: FCR below 70%: what’s breaking the chain
Symptom:
More than 30% of resolved tickets generate a follow-up contact within 7 days from the same customer on the same issue. Or your FCR tracking (via tags or automation) shows below 70% consistently.
Root causes and fixes:
Agents close tickets without full resolution because they lack the authority or the information to complete the fix. Fix: audit closed tickets with follow-up contacts. Identify the top 5 query types. Check whether agents have the tools and authority to resolve each one independently.
Wrong routing sends complex queries to agents who cannot resolve them, resulting in a close-and-callback pattern. Fix: review routing rules for query types with the lowest FCR rates.
No follow-up process means customers have to reopen issues themselves rather than being proactively contacted. Fix: build an automation rule that flags tickets not confirmed as resolved within 24 hours for agent follow-up.
How to verify the fix:
Track the repeat contact rate (contacts within 7 days from the same customer on the same issue). FCR improvements show in this number within 4 to 8 weeks of implementing routing and process changes.
Problem 3: abandon rate over 8%: it’s not always a staffing problem
Symptom:
More than 8% of callers hang up before reaching an agent. Rising abandon rate during off-peak periods (not just during volume spikes) is a particularly important signal.
Root causes and fixes:
IVR menus are too long. Customers navigate through 4 to 5 levels before reaching a queue. Fix: audit the average time from call start to queue entry. If it exceeds 90 seconds, shorten the IVR. Most callers should reach a queue within 60 seconds.
Wait times exceed customer tolerance. Fix: activate callback queue. Offering a callback when wait time exceeds 2 minutes reduces abandonment by 30 to 50% in most deployments.
Business hours do not match customer contact patterns. Customers call outside staffed hours and hang up. Fix: check your abandon rate by hour and day. If abandonment spikes at consistent times, those times need coverage or an out-of-hours message with alternative options.
How to verify the fix:
Track abandon rate daily for 2 to 4 weeks after changes. Abandon rate responds faster than FCR or CSAT to operational changes. Improvement is typically visible within 2 weeks.
Join our newsletter
The latest tips and deals delivered straight to your inbox.
Problem 4: CSAT is flat despite low AHT: the speed trap
Symptom:
AHT is at or below benchmark. Handle time is improving. But CSAT is not moving, or is declining. Customers seem dissatisfied despite faster resolution times.
Root cause:
Speed and resolution quality are not the same thing. Agents optimizing for low AHT are closing tickets before the issue is actually resolved. A fast close that requires a follow-up is a failed interaction, even if it looks good in the AHT report.
Fix:
Stop optimizing for AHT in isolation. Track FCR alongside CSAT. In most teams, a 1 percentage point improvement in FCR produces a 2 to 3 point improvement in CSAT. Set agent targets that combine speed and resolution quality rather than measuring them separately.
How to verify the fix:
Plot CSAT and FCR on the same chart over 8 weeks. They should move together. If FCR improves but CSAT stays flat, the problem may be agent tone or the quality of the resolution explanation, not the resolution itself.
Problem 5: agent utilization is too high (not too low)
Over-utilization is a burnout accelerator. Agents handling back-to-back calls with no time for wrap-up, documentation, or recovery make more errors, give shorter answers, and leave sooner. The metric looks efficient. The reality is an understaffed team burning through people.
Fix:
Add async channels (chat, email) to distribute volume away from phone. Async reduces per-contact cost and agent cognitive load.
Build a knowledge base that reduces repetitive information-gathering on calls.
Review staffing against actual contact volume by hour. Most over-utilization problems are scheduling problems, not headcount problems.
Consider AI features for agent assist to reduce wrap-up time and automate post-call documentation.
How to verify the fix:
Target utilization of 75 to 85%. Track error rate and CSAT alongside utilization. When utilization drops into the healthy range, error rates typically follow within 2 to 4 weeks.
Problem 6: escalation rate rising: where the breakdown happens
Symptom:
More than 15% of calls escalate to a senior agent or manager. Rising escalation rate over 6 to 8 weeks without a corresponding increase in contact complexity.
Root causes and fixes:
Agents lack the authority to resolve common issues. Refunds above a threshold, account changes, and exception handling all require manager approval. Fix: review escalation logs for the most frequent escalation reasons. For the top 3, evaluate whether tier-1 agents can be given authority to resolve with appropriate guardrails.
Knowledge gaps in the agent base. New cohorts escalate issues that experienced agents resolve independently. Fix: compare escalation rate by agent tenure. If new agents escalate 3 times more than senior agents, the problem is onboarding and knowledge access.
IVR routing mismatch. Complex calls are landing in general queues because IVR routing does not distinguish complexity. Fix: add a routing path for issue types that consistently escalate.
How to verify the fix:
Track escalation rate by agent and by query type separately. A falling escalation rate in a specific query type confirms the fix for that type. Overall escalation rate should decline within 4 to 6 weeks of routing and authority changes.
Problem 7: metrics look good, customers leave anyway: the measurement gap
Symptom:
AHT is on target. FCR looks acceptable. CSAT is above 80%. But churn is rising, NPS is declining, and customers are leaving for competitors.
Root cause:
You are measuring what is easy to measure, not what drives loyalty. CSAT after a call measures satisfaction with the interaction. It does not measure whether the issue actually mattered to the customer, whether resolution was permanent, or how much effort the customer had to expend to get there.
Fix:
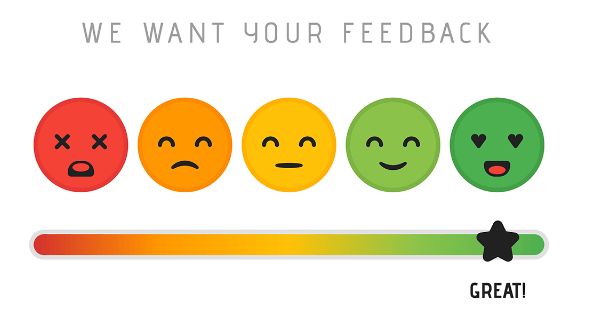
Add a customer effort score (CES) survey after ticket resolution. CES predicts churn better than CSAT in most B2B and subscription businesses.
Track NPS separately from CSAT. NPS captures relationship health, not just transactional satisfaction.
Review your most churned customers’ support histories. Pattern-match what the contacts looked like before they left.
How to verify the fix:
CES improvement is visible within 6 to 8 weeks of process changes. NPS is a lagging indicator and typically takes 3 to 6 months to reflect operational changes. Do not use NPS as a short-term operational metric.
A 4-week fix plan: where to start when everything needs work
When multiple metrics are below target, prioritize in order of customer impact and fix speed.
Week 1 to 2: fix abandon rate
Abandon rate responds fastest to changes and has immediate customer impact. Activate callback queues, shorten IVR menus, and add coverage for high-abandon time periods. Visible improvement within 2 weeks.
Week 2 to 4: fix FCR
Audit your top escalation and repeat-contact drivers. Fix the top 3 routing or authority issues. FCR improvements are visible within 4 to 8 weeks but the root cause work starts now.
Week 3 onward: address AHT and CSAT together
AHT and CSAT should be worked on in parallel, not in sequence. Reducing AHT without tracking FCR impact produces short-term gains and long-term CSAT problems. Set combined targets for both.
For a structured operational framework to support this plan, see the call center operations guide. For the tools to track progress, explore LiveAgent reporting features.
Abandon rate. Activating a callback queue and shortening an IVR menu can reduce abandon rate within 2 weeks. It requires no agent retraining and produces immediate customer experience improvement. Start here if your abandonment is above 8%.
Yes. The most effective AHT reductions come from knowledge base improvements and routing fixes, not from asking agents to speak faster. AI features for agent assist can reduce wrap-up time and surface the right answer faster without reducing resolution quality.
The three most common causes are: (1) a product change or new feature that agents have not been trained on, (2) a new agent cohort with incomplete onboarding, (3) an IVR change that routes queries incorrectly. Diagnose by checking FCR trends against the date of each change. The drop will correlate with one of them.
Abandon rate: 2 to 4 weeks. FCR: 4 to 8 weeks. CSAT: 2 to 3 months. NPS: 3 to 6 months. Do not measure the success of a fix too early. FCR changes in particular require sufficient ticket volume to be statistically meaningful.
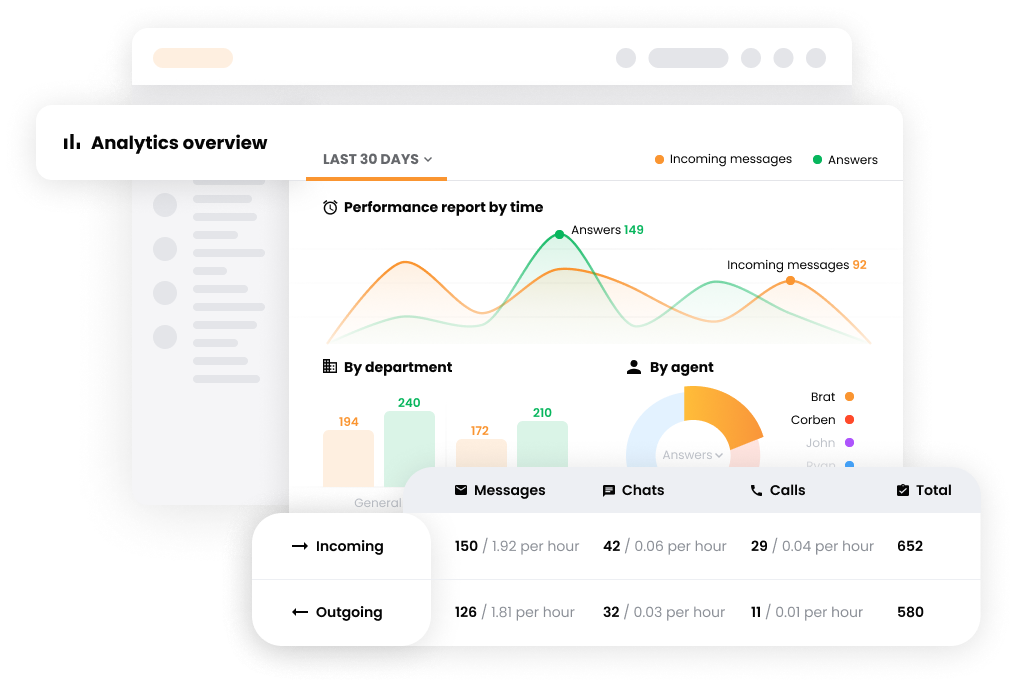
Call recording lets you audit what actually happens on calls versus what the metric says. Reporting tools that break down AHT by agent, query type, and IVR path let you isolate where time is being lost. Agent feedback surveys surface knowledge gaps that reports miss. LiveAgent includes reporting and call recording in all paid plans.
Depends on your current numbers. If your FCR is below 65%, fix FCR first. Low FCR drives repeat contacts, which inflates volume and makes every other metric worse. If FCR is above 75% but AHT is 40% above benchmark, fix AHT. In most cases, the two are linked: fixing the root cause of long AHT (routing, knowledge gaps) also improves FCR.
How to Track Call Center Metrics in LiveAgent (AHT, FCR, CSAT)
Step-by-step: how to set up call center metric tracking in LiveAgent. AHT, FCR, CSAT, agent utilization and more - from dashboard setup to automated reports.
Audit your call center's efficiency using a comprehensive checklist that includes performance metrics, agent efficiency, processes, scripts, recruiting, trainin...
Explore the top 12 call center metrics, including service level, ASA, FCR, AHT, and more, to enhance performance and track KPIs. Discover global benchmarks and ...
5 min read
Call Center Software
You will be in Good Hands!
Join our community of happy clients and provide excellent customer support with LiveAgent.