


Customer service reports features
Customer service reports offer insights into performance, improvement areas, and top-performing departments. Regular reviews ensure customer satisfaction and lo...
9 min read
Reporting
Analytics
+1
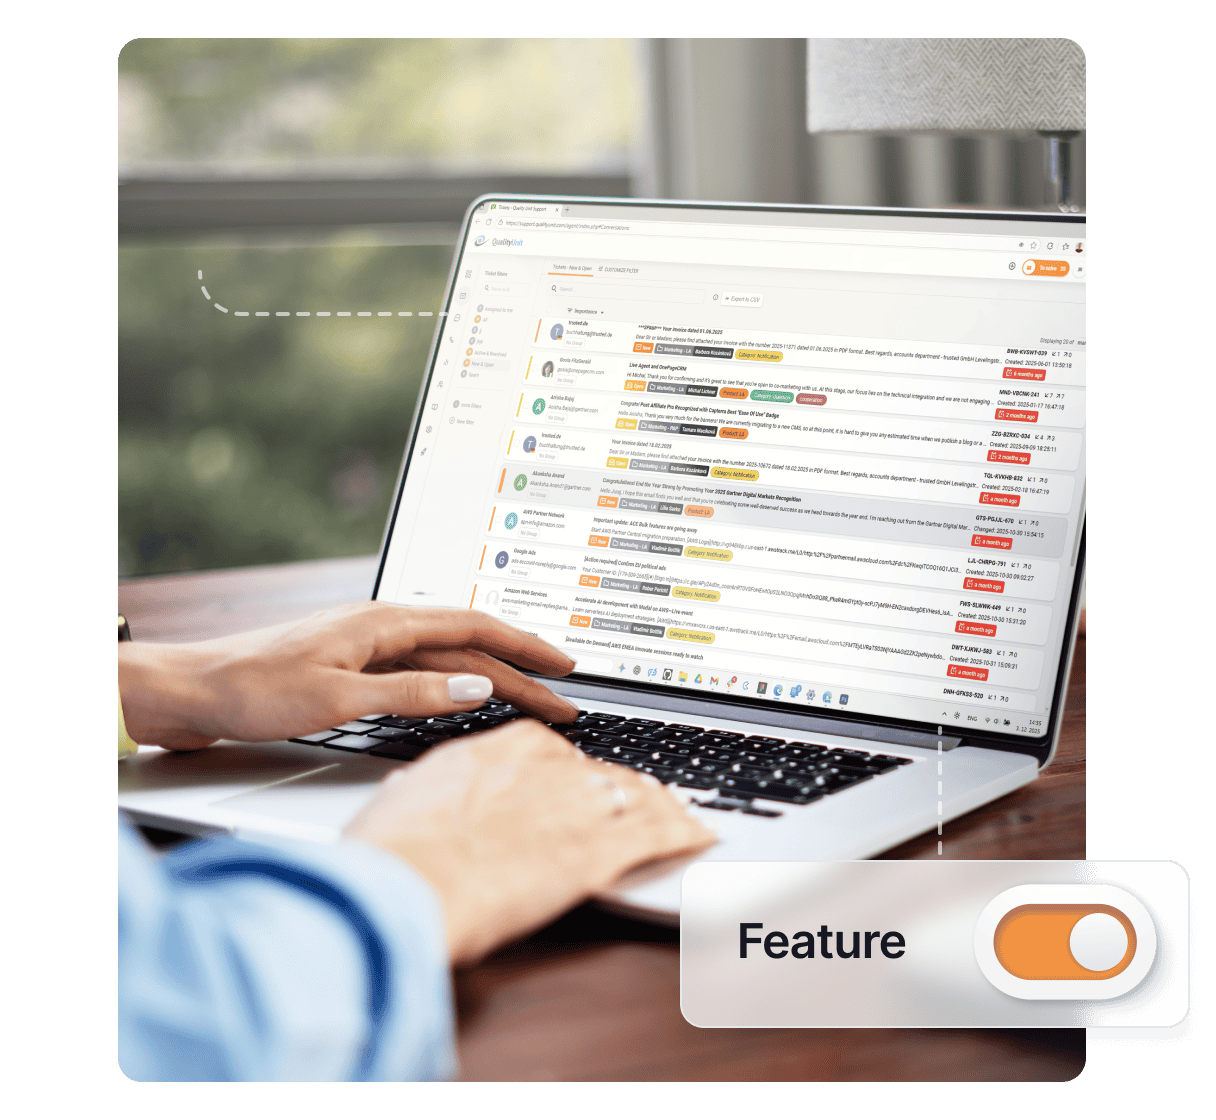
LiveAgent’s analytics overview offers insightful data to enhance customer support and sales by identifying high and low-performing areas. Filter metrics by time, department, agent, tag, and channel. Try a free trial to explore these features.
Analytics uses raw data and math to discover, interpret, and communicate significant data patterns. When used correctly, data analytics can help answer business questions, predict outcomes, and create actionable insights.
An analytics overview is an invaluable part of your software for customer service management. It can help you pinpoint the exact areas of your business that need improvement. Finding “laggards” and areas that could be optimized is always great because it presents an opportunity to:
In addition to that, an analytics overview can also showcase areas of your business that are thriving. This is important because:
Accessible and convenient data is an invaluable part of the best help desk software solutions in today’s market. The analytics overview gives you a holistic overview of your customer support. You’ll be able to see who is interacting with your company and monitor the service they’re receiving. You’ll also be able to review usage statistics by channel, evaluate performance reports, and learn from customer satisfaction ratings. In addition to that, our analytics overview is packed with endless reporting capabilities.

Start your free trial today and see results within days.
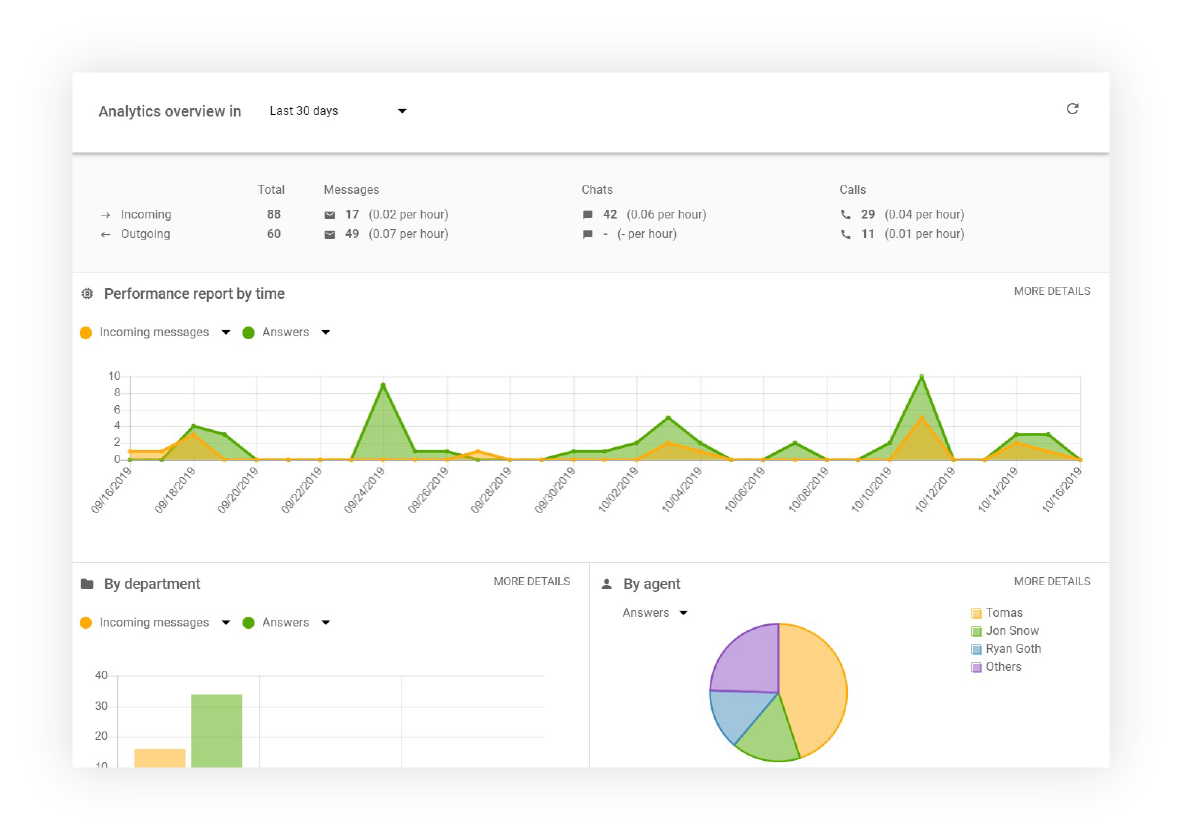
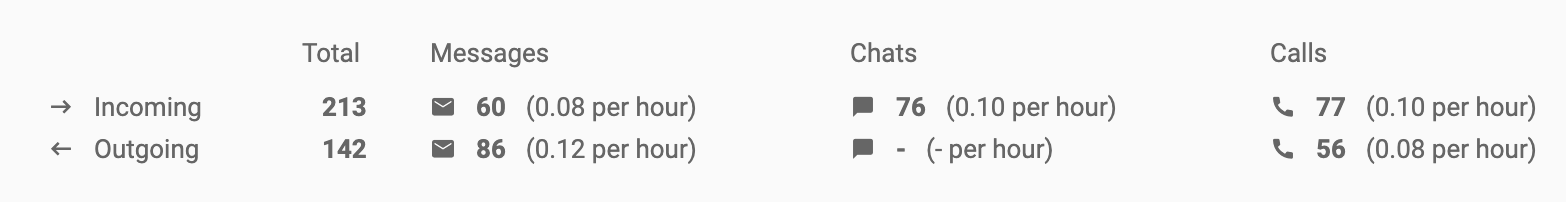
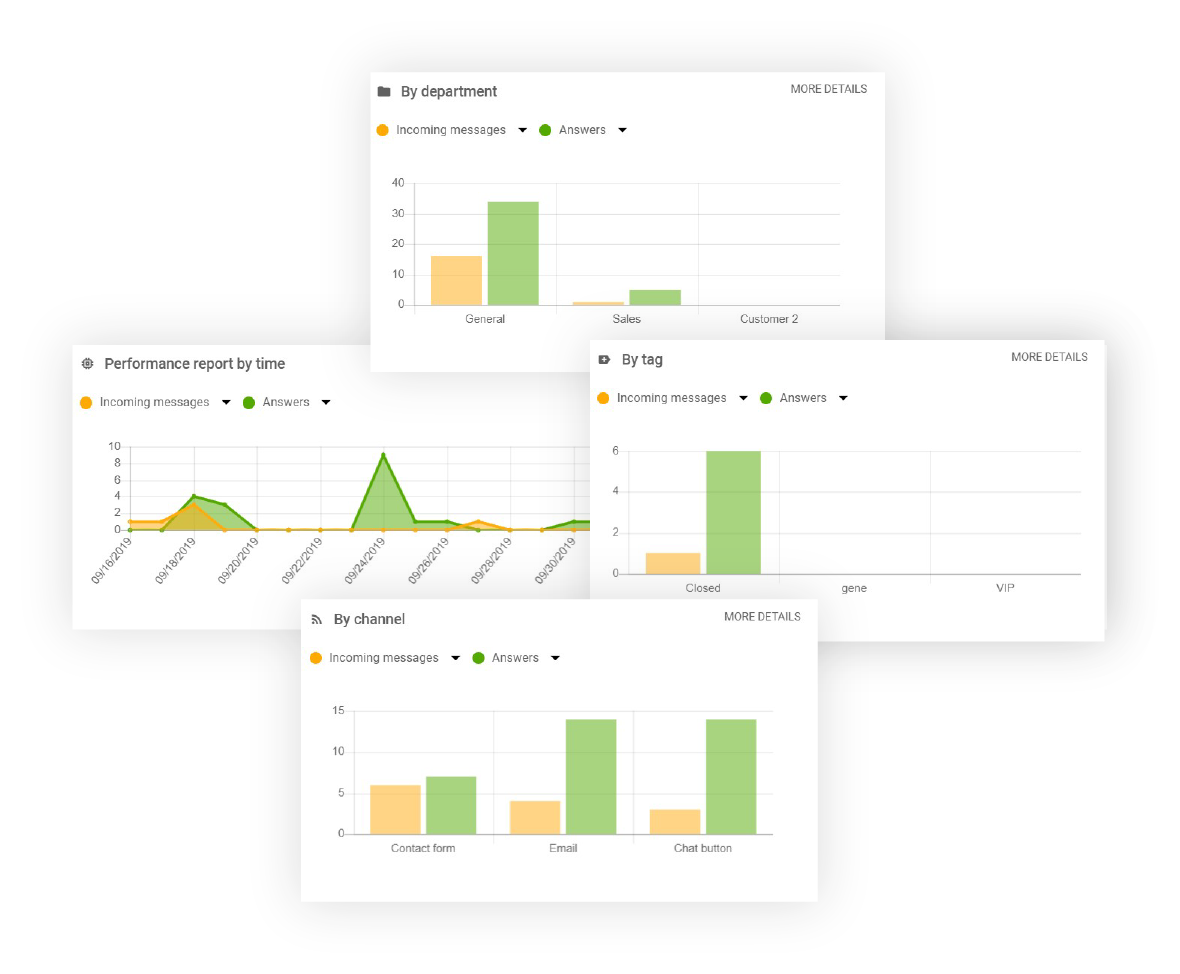
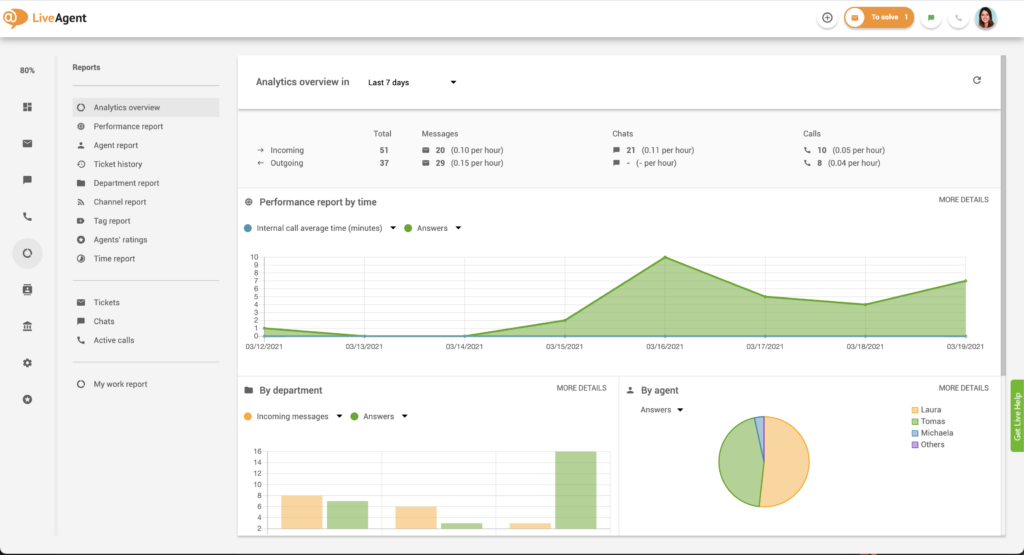
The analytics dashboard gives you a quick overview of all incoming and outgoing messages, chats, and calls.

You can filter your analytics overview by:
Each performance report can be modified to showcase additional data including:
Each report can be filtered by different time periods including:
The latest tips and deals delivered straight to your inbox.
LiveAgent can present all the above-mentioned data in multiple formats, including area charts, line graphs, bar graphs, and pie charts. Moreover, all data can be exported into CSV files, making it easier to share with others.
The analytics dashboard is visible to administrators only, so make sure you’re an admin of your LiveAgent account (agents can see their personal statistics upon logging into LiveAgent.)
If you do have the administrator role, you can find the analytics overview by clicking on Reports (circle icon) that’s in the left-hand menu (right between Calls and Customers).
To learn more about the different types of reports available in our analytics dashboard please check out our knowledge base articles:
Handle all customer inquiries from one interface. Start improving your customer service with a free 30-day trial today!
Customer service reports offer insights into performance, improvement areas, and top-performing departments. Regular reviews ensure customer satisfaction and lo...
Monitor and boost your support team's performance with LiveAgent's customizable reports, charts, and API integration. Try a free 30-day trial!

Master customer service analytics to boost satisfaction! Explore techniques, AI tools, and trends to optimize support and make data-driven decisions.
Join our community of happy clients and provide excellent customer support with LiveAgent.
Cookie Consent
We use cookies to enhance your browsing experience and analyze our traffic. See our privacy policy.