Measure and improve key live chat metrics for your success
Discover 15 crucial live chat metrics to boost business success in 2025. Learn to measure, improve KPIs, and create performance reports. Enhance chat operations with AI and automation. Try LiveAgent for free to optimize customer interaction strategies.
Published on Jan 20, 2026 by Patricia Krajcovicova.Last modified on Jan 20, 2026 at 7:35 am
Live chat has become a crucial tool for businesses to connect with their customers in real-time. But how do you know if your live chat strategy is working? That’s where live chat metrics come into play.
Let’s dive into the world of live chat metrics and key performance indicators (KPIs) to help you measure and improve your chat game. We’ll uncover the 15 crucial live chat metrics you need to track in 2025. Are you ready to chat your way to success? Let’s jump right in!
What are live chat metrics, and why should you care about them?
Live chat metrics consist of numbers and data that provide insights into the performance and effectiveness of your live chat interactions. They help you understand how well your team is serving customers, identify weak areas that need improvement, and measure the impact of your chat support strategy. But why should you care about them?
Well, think of live chat metrics as a way to keep customers happy and loyal. When you pay close attention to these numbers, you gain a deeper understanding of your customer’s experience, and therefore, you can make data-driven decisions to enhance it. You want your customers to feel understood, supported, and satisfied, right?
Let me give you an example of how ignoring live chat metrics can lead to a higher customer churn rate. Imagine you have a high average chat response time, meaning, it takes your customer service team an eternity to respond to customer inquiries. The customers become frustrated and eventually, they leave to search for a quicker and more responsive alternative. However, by monitoring and improving your chat response time, you can prevent this potential customer churn and keep your customers happy.
The average response time depends on the communication channel. For live chat, it is about 30-45 seconds on average. Research shows that 59% of customers are more likely to purchase from a company if their response time is under 1 minute. On the other hand, if the first response time is high, the customer experience decreases, and the possibility of the customer churning increases.
So, don’t overlook the power that live chat metrics have. They hold the key to providing exceptional customer service and ensuring long-term business success.
15 crucial live chat metrics to elevate your business
Live chat metrics can be categorized into two groups, both of which are crucial for maximizing the potential of your live chat support.
The first group consists of metrics that can be directly influenced by your support agents and their training. These metrics give you a valuable overview of the efficiency and effectiveness of your team’s chat interactions.
The second group consists of more business-focused metrics that can assist with making strategic decisions and help you understand the impact of the chat support strategy on your overall business performance.
Metrics that are important for your team
1. Total number of chats
The first fundamental live chat metric to track is the total number of chats. This metric shows you how many chat conversations your team is handling within a specific time period. It provides a clear picture of the volume of customer inquiries and the workload of your chat agents.
Key Performance Indicators (KPIs) related to the total number of chats can include:
Chat volume by hour, day, or week
The average number of chats per agent
Chat volume trends
Chat satisfaction ratio
How to implement and improve this metric:
Use the data to make informed decisions and optimize your live chat support. By tracking the total number of chats, you can identify peak chat times which helps you allocate your resources accordingly.
Optimize your chat routing system to ensure that all the incoming chats are evenly distributed among your agents. This will help reduce customer wait times.
Measure the impact of your marketing campaigns or any website changes on the chat volume. This allows you to make data-driven adjustments to your strategy.
Invest in a live chat software or tool that can track and capture accurate data on the total number of chats handled by your team.
Invest in agent training and give them the necessary tools that will enable them to handle more chats efficiently.
2. First response time (FRT)
You send an important message to a friend and eagerly await their response. As minutes tick by with no reply, frustration starts to creep in. This same frustration can be experienced by your customers when they reach out to your customer support team. That’s where the importance of the first response time (FRT) metric comes into play.
FRT measures the average time it takes for an agent to respond to a customer’s initial message. It’s a key metric because it sets the tone for the entire chat interaction. In addition, real-time typing insights provide agents with a view of customer messages in progress, helping to reduce response times and increase accuracy. A quick first response creates a positive impression, while a long wait time can leave customers feeling ignored.
Key Performance Indicators associated with FRT include:
Average first response time (in seconds or minutes)
Percentage of chats that receive a response within a specific timeframe
Average FRT by agent
How to implement and improve this metric:
Make sure you prioritize promptness without compromising quality.
Set a target response time that aligns with your customer expectations and standards within your industry.
Invest in reliable live chat software that can track and monitor the FRT in real-time.
Take steps to reduce the response times – optimize chat routing, provide agent training, and utilize automation tools like canned responses or chatbots.
3. Missed chats
Missed chats refer to the number of chat requests that go unanswered. This metric measures how often customers are left without help from your customer support agents.
KPIs associated with missed chats include:
The percentage of missed chat requests
The average number of missed chats per agent
Reasons for missed chats
Improvement rate
How to implement and improve this metric:
Set a target for an acceptable missed chat rate and also set the percentage of chats you aim to answer. Prioritize responsiveness and ensure that customer inquiries do not fall through the cracks
Analyze and identify gaps in your chat support to allocate resources more effectively.
Use automatic chat routing and assignment to help distribute the workload more evenly.
Set up proactive chat invitations or chatbot greetings to reduce the chances of missed chats by initiating conversations with customers.
4. Messages per chat
Just imagine having a chat conversation that feels like a never-ending novel, with messages piling up and leaving both parties exhausted. That’s why messages per chat is another important metric to take into consideration. It measures the average number of messages exchanged between a customer and a customer support agent during a chat session. By minimizing the number of messages per chat, you can enhance the overall customer experience and ensure that both parties engage in a meaningful and efficient conversation.
KPIs associated with messages per chat include:
The average number of messages per chat
Distribution of chat length (for example, percentage of short chats versus long chats)
Find the right balance between comprehensive assistance and efficiency.
Use reliable live chat software that is capable of tracking and recording the number of messages in each chat conversation.
Train your agents in effective communication skills. Teach them how to provide concise and clear responses by actively listening to customers’ needs.
Take advantage of canned responses or templates that can help streamline responses to common inquiries and reduce back-and-forth messaging.
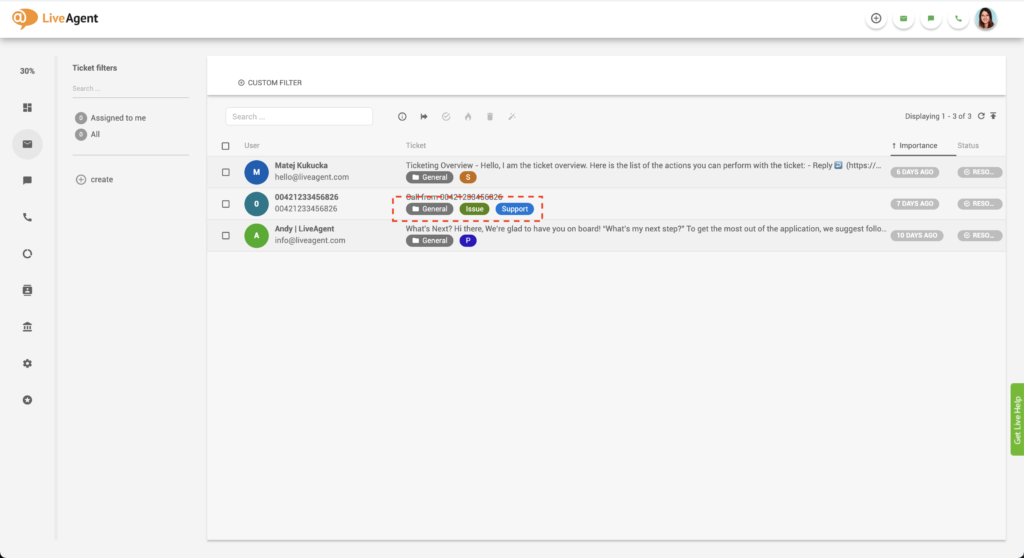
5. Usage of tags
Tags are like colorful labels that improve the organization and categorization of chat conversations based on specific topics, issues, or customer attributes. By optimizing the usage of tags, you can easily track and analyze chat conversations based on specific criteria, identify trends, find areas that need improvement, and make data-driven decisions to boost the overall customer experience.
The KPIs may include:
Percentage of tagged chat conversations
Average number of tags per chat
Distribution of tags across different categories or topics
Usage of tags by specific agents or teams
Tags used for high-priority issues
How to implement and improve this metric:
Make sure the tags can be easily added to chat conversations. Allow your agents to choose from predefined tag options or create new tags if needed.
Explain the importance of tags and how to effectively use them. Provide them with clear guidelines and examples of when and how to use tags.
Regularly evaluate and update the list of available tags based on evolving trends or customer needs.
6. Average handle time
Have you ever been on a live chat with a customer service representative who seemed to take forever to resolve your issue? It can be quite frustrating, right? That’s why you need to understand the importance of the average handle time (AHT) metric. It measures the average time it takes for an agent to handle a chat session from start to finish.
Key Performance Indicators (KPIs) associated with AHT include:
The average handle time per agent
Average handle time across different chat types or complexity levels
Transfer rate – the percentage of chats that are transferred to another agent or department
How to implement and improve this metric:
Optimize agent efficiency without compromising the quality of customer service.
Train your agents. Focus on improving typing speed and their multitasking abilities, and teach them how to use canned messages.
Provide agents with resources such as a knowledge base or FAQs that help them find solutions quickly, reducing handle time.
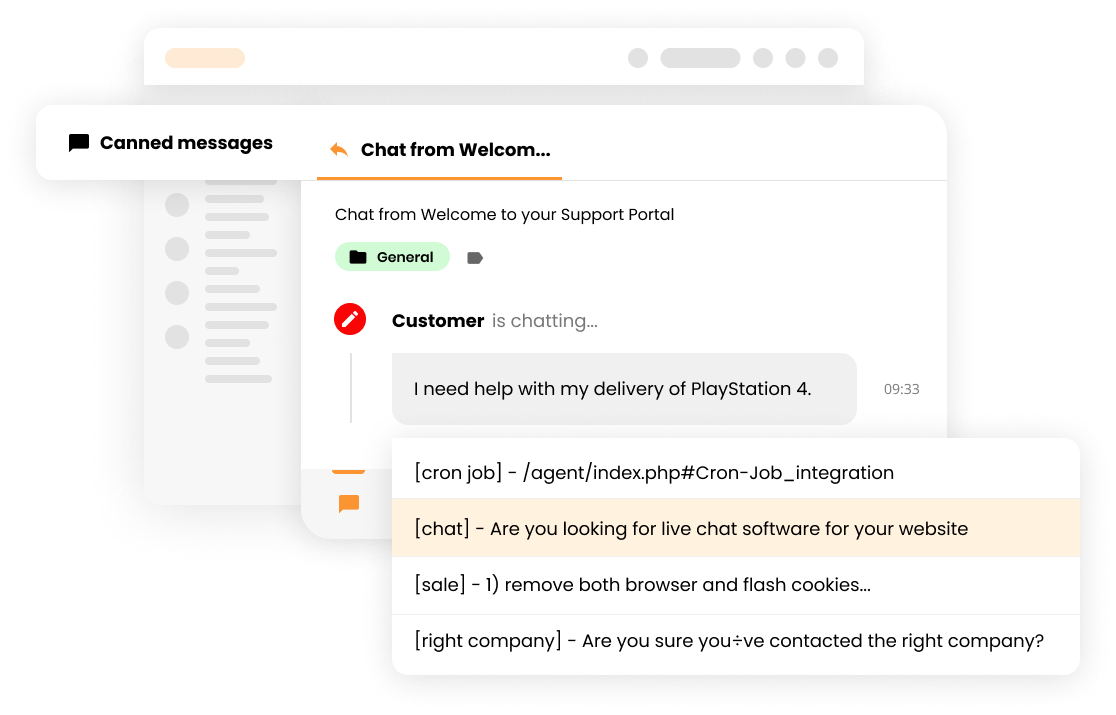
7. Use of canned response
As you may have noticed, we’ve already mentioned canned responses a few times. But what are they and what does this metric show us? Canned responses are pre-written messages that address common customer inquiries. Agents can use them instead of manually typing the message which helps streamline chat conversations, reduce response time, and maintain consistency in customer service. The metric measures how frequently agents use these pre-written responses to address customer inquiries.
KPIs related to the use of canned responses may include:
The percentage of chats where a canned response was used
Average number of canned responses per chat
The customer satisfaction rate for chats containing canned responses
Time saved per chat due to canned responses
How to implement and improve this metric:
Allow agents to have easy access to canned responses within the chat interface and let them create their own.
Make sure the canned responses are up-to-date and accurate.
Update canned response templates based on customer feedback and changing trends to improve their effectiveness.
Keep it balanced and ensure that agents personalize responses when necessary, making customers feel heard and valued.
Metrics that are important for your business decisions
8. Chat-to-conversion rate
What if your live chat not only helped with answering customer questions but also acted as a powerful sales tool? The chat-to-conversion rate measures the percentage of chat conversations that result in a successful conversion. This can include a purchase, sign-up, or other desired actions.
The important KPIs include:
The percentage of chats that result in a conversion
Conversion time – how long it takes for a chat interaction to result in a conversion
Conversion rate by agent
Conversion rate in a specific time period
Conversion rate by proactive versus reactive chats
Percentage of conversions after a follow-up action
How to implement and improve this metric:
Implement a live chat software that integrates with your website analytics and conversion tracking tools. This allows you to track and analyze the outcome of chat interactions in relation to conversions.
Ensure that your live chat agents are trained not only in customer service skills but also in sales techniques. They need to be able to identify sales opportunities during chat interactions and guide customers toward conversions.
Give your agents access to product details and special offers that can help boost conversion rates.
Optimize chat invitations and proactive chats that can prompt website visitors to engage in conversations, increasing the chances of conversions.
Analyze chat transcripts and identify potential areas of improvement. Pay attention to missed opportunities and try to avoid them to generate more sales.
9. First contact resolution rate (FCR)
The first contact resolution rate (FCR) measures the percentage of chat interactions that are resolved during the first contact between the customer and agent, without the need for any follow-up. Focusing on improving this metric can enhance customer satisfaction and provide a seamless chat experience that leaves customers more satisfied. After all, who doesn’t love to have their issues resolved swiftly and efficiently?
Key Performance Indicators (KPIs) for FCR include:
Percentage of chats resolved without requiring any follow-up or escalation
The average time at which issues are resolved during the first contact
FCR rate by agent or department
Reasons for unresolved issues
Percentage of chats that result in a return contact or escalation
How to implement and improve this metric:
Track and record the outcome of each chat interaction, whether it was resolved or required further assistance.
Make sure to find the reasons behind unresolved issues and try to come up with a strategy to avoid this from happening again.
Provide necessary training and resources to resolve customer issues independently. Having comprehensive training, product knowledge, and access to a centralized knowledge base improves the agent’s ability to address customer inquiries effectively.
Implement chat routing rules that connect customers to the most suitable agent for their specific query. This can increase the likelihood of resolving issues during the first contact.
10. Customer satisfaction score (CSAT)
Alright, now, let’s talk about the customer satisfaction score (CSAT), the holy grail of measuring how satisfied your customers are with their live chat experience. It’s one of the most important metrics because it tells you how well you’re meeting customer expectations, keeping them happy, and creating loyal relationships.
The key indicators for CSAT include:
The average customer satisfaction score
Percentage of highly satisfied customers
Number of customer complaints or negative feedback
Comparison of CSAT scores across different customer segments or demographics
How to implement and improve this metric:
Use a simple post-chat survey where customers rate their satisfaction with the chat support they received. Keep it short and simple.
Make improvements based on the customer feedback that will benefit both the business as well as the customers.
To improve your CSAT score, make sure to provide empathetic and personalized support that gets to the heart of the problems. Don’t be afraid to go the extra mile to provide exceptional service.
Provide training sessions to your agents to improve their skills and problem-solving abilities. Equip your agents with everything they need to deliver outstanding customer service and address customer concerns effectively.
Celebrate and reward agents who consistently receive positive CSAT scores. This will motivate them as well as the entire team, and help maintain a high level of customer satisfaction.
11. Net promoter score (NPS)
Net Promoter Score, also known as NPS, is a metric that goes beyond just measuring customer satisfaction. It’s like a barometer of your customers’ loyalty and their willingness to recommend your business to others. Remember, improving your NPS takes time, dedication, and a desire to go above and beyond.
The KPIs for NPS include:
The overall NPS is calculated by subtracting the percentage of detractors (customers who are unlikely to recommend) from the percentage of promoters (customers who are highly likely to recommend)
Net promoter score by different customer segments
NPS by different touchpoints (for example, customer service or product quality)
The change in NPS over time
How to implement and improve this metric:
You need to ask your customers a straightforward question: ‘On a scale of 0 to 10, how likely are you to recommend us to a friend or colleague?" Based on their response, customers are categorized into Promoters (9-10), Passives (7-8), or Detractors (0-6).
Determine the best method for survey distribution, such as email, website pop-ups, or post-chat surveys. Make sure the survey reaches a big enough sample of your customer base.
Analyze the feedback from both promoters and detractors to gain insights into what is driving their likelihood to recommend or not recommend your business. Look for patterns in the responses.
After that, identify key areas that need improvement. These changes could be related to different touchpoints like product features, customer service, or overall customer experience.
Monitor the impact of the changes and improvements on your NPS.
12. Website visitors to chats
Your website is like a marketplace with potential customers strolling through, browsing your products and services. Now, imagine the moment when a visitor stops being just another browser and starts engaging in a chat conversation with a friendly chat agent. That’s the beauty of knowing how to track website visitors. This metric measures the percentage of website visitors who initiate a chat conversation, providing insights into how effectively you’re enticing visitors to engage with your chat support.
The key indicators for this metric include:
The percentage of visitors who initiate a chat
Average time on the website before initiating a chat conversation
Conversion rate from visitor to chat participant
The conversion rate after the chat
Exit rate after chat request
How to implement and improve this metric:
First and foremost, make sure your website design is user-friendly, providing easy access to the chat feature. You can also experiment with different placements to maximize engagement.
Encourage your visitors to initiate a chat by crafting attention-grabbing chat prompts or call-to-action messages.
Implement proactive chat invitations based on visitor behavior.
Try to train your agents to respond to chat requests promptly. Improve the average wait time for the chat by using chat routing rules or chatbots to handle basic inquiries.
Track your progress over time, compare your metrics against industry benchmarks, and make adjustments to your strategy.
13. Total number of tickets
Let’s talk about the total number of tickets, a metric that gives you a glimpse into the volume of customer inquiries sent to your customer support team that needs resolution.
Key Performance Indicators (KPIs) for the total number of tickets can include:
The average number of tickets per specific time period (day, week, month)
Ticket distribution by category or urgency level
Average resolution time for each ticket
Ticket backlog – the number of unresolved tickets waiting in the queue
How to implement and improve this metric:
Most importantly, you will need help desk software or a ticketing system that automatically generates tickets for each customer interaction.
Categorize tickets to organize and prioritize tickets based on their urgency and complexity. This helps the entire support team effectively address all the tickets.
Provide self-service options on your website like knowledge bases, FAQs, or video tutorials. By giving your customers easy access to comprehensive self-help material, you can reduce the number of tickets.
Take advantage of automation tools like chatbots or canned responses to automate repetitive tasks and provide immediate responses to common inquiries.
Regularly review ticket data to identify trends, common issues, or areas of improvement. By understanding the root of the large volume of tickets, you can proactively address them and reduce the amount of tickets.
14. Customer effort score (CES)
Customer Effort Score (CES) is a metric that measures how easy or difficult it is for customers to achieve their desired outcomes when interacting with a company. It focuses on minimizing customer effort and enhancing the overall customer experience. Customers are typically asked to rate their level of agreement with statements such as ‘My issue was resolved quickly" or “The company made it easy for me to find what I was looking for.” CES helps businesses assess the effectiveness of their support processes, website navigation, or overall customer journey.
The KPIs for CES include:
The average customer effort score
Distribution of scores across different customer segments
The correlation between CES and other metrics like customer satisfaction
Impact of CES on customer loyalty
How to implement and improve this metric:
Create a survey and ask customers to rate their chat interaction. The question could look like something like: “On a scale of 1 to 5, how easy was it to find a solution to your problem?”
Collect and analyze the survey responses to calculate your CES score.
Identify pain points in the feedback. Pay attention to specific areas where customers are experiencing high effort or frustration. Don’t forget to use them to improve your strategy.
Simplify your chat process by minimizing unnecessary steps in your chat interface. The goal is to make it as easy as possible for customers to get the help they need, and glide through their support journey with satisfaction.
15. Agent utilization rate
Last but not least, let’s look at the agent utilization rate. This metric measures how effectively your agents are utilizing their time to handle customer inquiries. It basically determines if your agents are operating fully or idling around.
The KPIs for agent utilization rate can include:
The percentage of time agents spend in active chat sessions versus the time they are unavailable
Average chat duration
Total working hours
Number of chats handled per hour or day
Number of chats handled by a specific agent per certain time frame
Customer satisfaction rating
How to implement and improve this metric:
Set clear goals and define your target agent utilization rate based on team capacity and customer demand.
Optimize scheduling to make sure agents’ working hours align with customer demand. Identify peak chat hours and allocate resources accordingly.
Provide your agents with the right tools to streamline processes, automate common tasks, and facilitate faster and more efficient chat interactions.
Utilize chat priority routing rules to match customers with the most qualified and available agents. This ensures that agents are handling chats that align with their expertise, improving efficiency and customer satisfaction.
Gather feedback from agents and customers to identify pain points and areas for improvement. Use it to refine your strategy, implement changes, and enhance agent utilization rate.
What is an agent performance report, and how to make one?
Agent performance report is a document that evaluates the day-to-day performance of agents based on key metrics and KPIs. It provides insights into agent productivity, customer satisfaction, and their overall effectiveness in handling chat interactions.
Now, let’s discuss how you can make an agent performance report. It’s quite simple. All you need is access to chat analytics and reporting tools provided by your live chat solution which should automatically collect data on various metrics.
For example, LiveAgent offers a performance report feature that allows you to track individual agent performance. It contains detailed reports on metrics like:
Total number of opened chats
Number of resolved tickets and calls
Missed chats
Chat pickup average time
Average chat time
Percentage of positive and negative ratings
and more
These performance reports can be displayed as graphs or charts, and segmented by day, week, month, year, or your own custom time frame.
How can AI and automation enhance live chat performance?
Imagine that you’re browsing a website when suddenly, a chat window pops up with a friendly message offering assistance. But, instead of a human agent, you’re chatting with an AI-powered bot. Welcome to the world of AI and automation in live chat! These innovative technologies are transforming the customer service experience as we know it. Let’s explore how AI and automation enhance live chat.
What role do AI and automation play in optimizing metrics?
The role of AI and automation shouldn’t be overlooked when it comes to optimizing your live chat metrics and performance. They can streamline processes, improve efficiency, and enhance customer experience. How, you may ask? Let’s dive right into it!
Faster Response Time
We’ve already talked about how frustrating it can be for customers to wait too long for an answer from customer support, especially if they contact them through live chat. It’s called LIVE chat for a reason, right? But, by introducing AI-powered chatbots, they can instantly respond to common customer inquiries, reducing response time and improving the first response time metric. They are trained to provide replies to customer FAQs and give them relevant information, allowing agents to focus on more complex issues.
For example, a customer reaches out to a travel agency website for information on flight bookings. The chatbot instantly provides available options, pricing, and booking details, which provides quicker response times and helps achieve a faster resolution.
Availability 24/7
Being available 24/7 is one of many great perks that come with implementing chatbots. They allow you to have live chat support available round the clock, even outside of regular business hours. It helps increase customer satisfaction by providing assistance whenever customers need it, and it also has a positive impact on metrics like customer satisfaction score (CSAT).
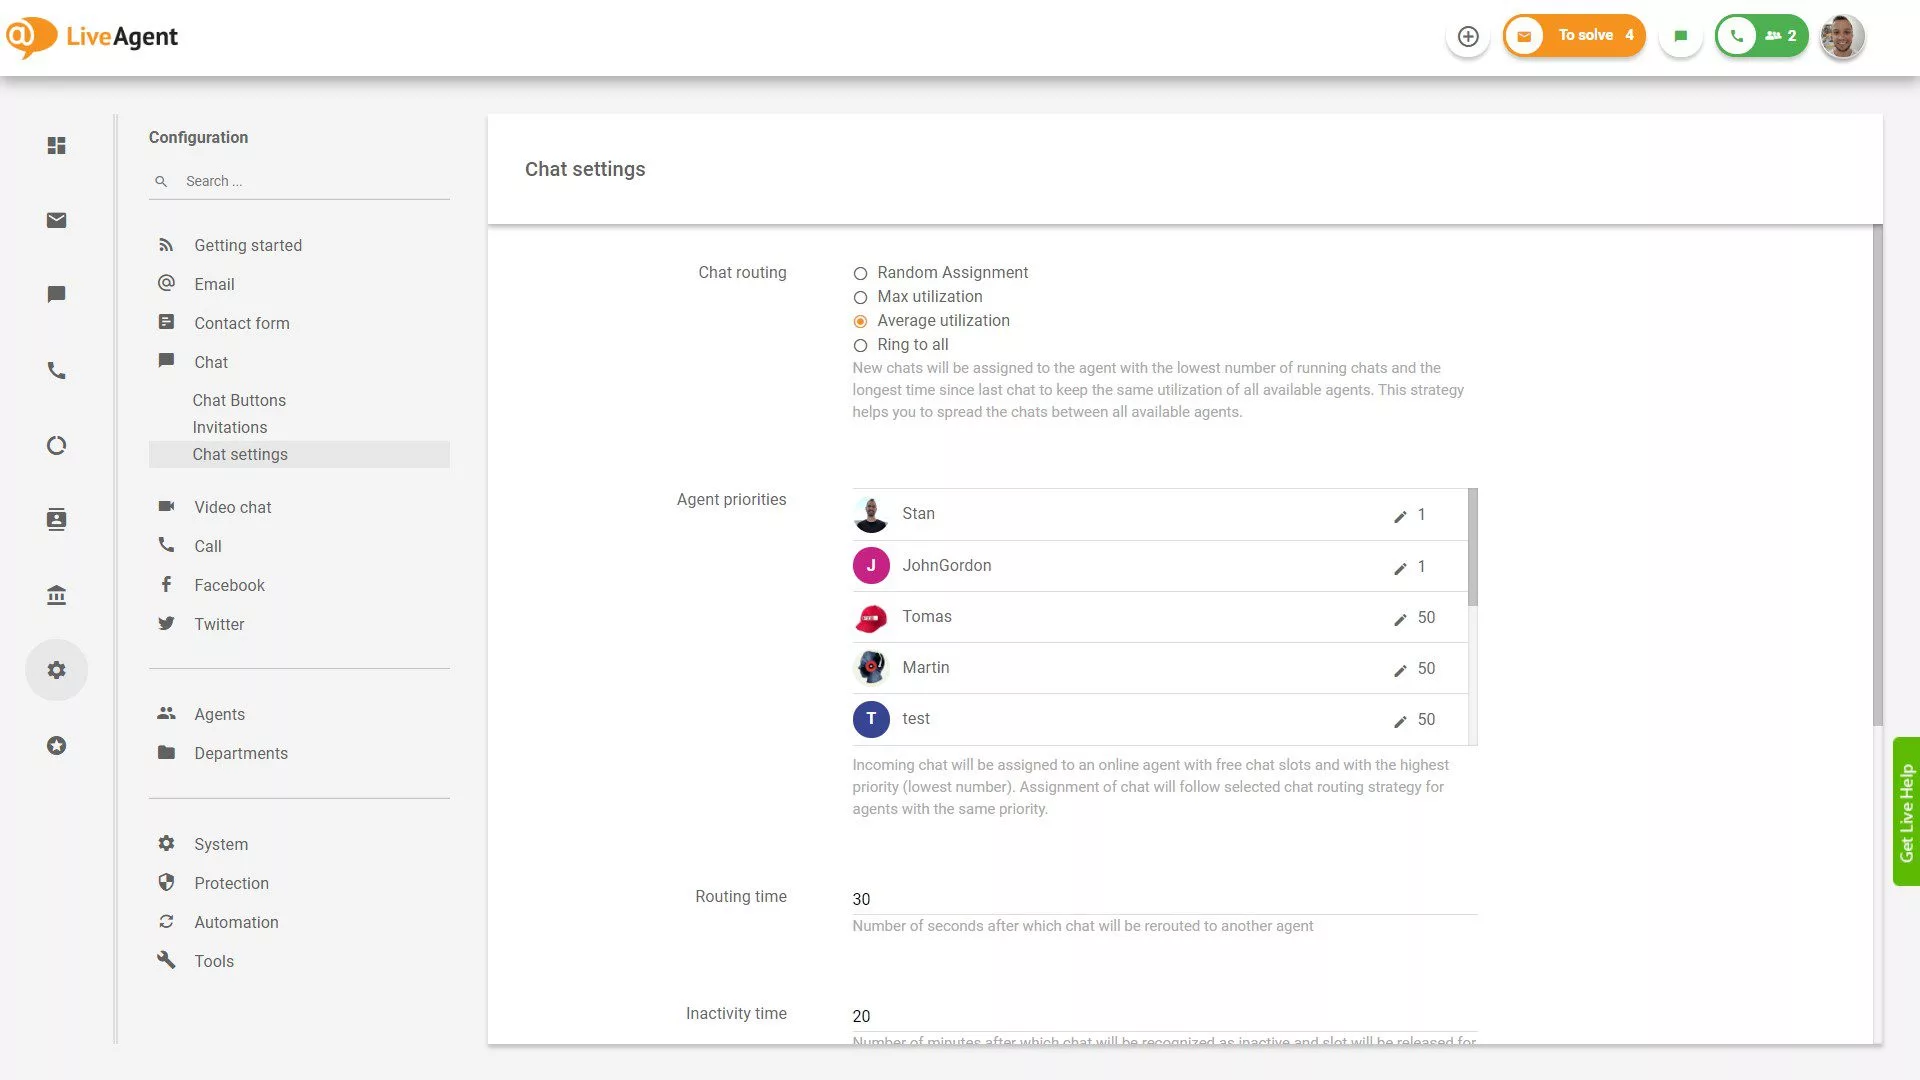
Efficient Routing
Ensure that all chats are handled efficiently, and optimize metrics like chat resolution time and customer satisfaction. The advanced AI algorithms can intelligently route chats to the most suitable agent based on predefined rules and customer attributes. These automated distribution methods ensure your agents always have optimal service ticket loads.
For instance, an AI system analyzes customer data and routes a chat about technical support to an agent specialized in solving technical issues, leading to quicker resolution and higher customer satisfaction.
Data Analysis and Insights
AI and automation tools can effortlessly analyze large amounts of data generated from live chat interactions. They can help you uncover patterns, trends, and customer preferences, allowing you to make data-driven decisions to improve metrics such as average handling time (AHT) and customer retention.
As an example, AI algorithms can identify FAQs and suggest improvements to your knowledge base, enabling agents to provide quicker, more accurate answers and reducing AHT.
Ready to enhance live chat metrics?
So, after everything we discussed, are you ready to take your live chat metrics to the next level? LiveAgent can be the ultimate solution! Unlock a plethora of features and tools that will help you optimize your metrics and deliver exceptional customer experiences.
Here’s how LiveAgent can make a difference:
Centralized ticketing system: LiveAgent offers a centralized ticketing system that seamlessly integrates chats, calls, emails, social media, and more. By having all customer communications in one place, you can easily track and analyze the metrics that matter most to your business.
Reporting and analytics: With robust reporting and analytics capabilities, you can track various live chat metrics, including chat volume, response time, customer satisfaction scores, and agent performance. This allows you to make changes supported by data and continuously improve your metrics.
Intelligent chat routing: LiveAgent’s intelligent chat routing ensures that each chat is directed to the most suitable agent based on skill set, availability, or predefined rules. This chat routing automation enhances metrics such as resolution time and customer satisfaction.
Extensive integrations: Seamless integration with various third-party tools enables you to leverage external data sources and enhance your live chat metrics. Whether it’s CRM systems, e-commerce platforms, or customer feedback systems, LiveAgent’s got you covered!
Conclusion
To summarize everything, tracking your live chat metrics is vital for success in providing exceptional customer service. By understanding metrics like average handle time, first response time, customer satisfaction score, or customer effort score, you can optimize your strategy and continuously improve the experience of your customers.
Remember, these metrics are more than just numbers on a chart – they represent the satisfaction and loyalty of your customers. By paying attention to them and making data-driven decisions, you can create a chat experience that keeps customers coming back for more.
If you’re looking for a reliable solution that will help you keep a track on these live chat metrics and optimize them, LiveAgent can be the perfect option. With its wide range of features, LiveAgent can help you do all that. Sign up for the 30-day free trial and experience all the benefits firsthand.
But hey, this article only scratches the surface of live chat metrics. If you want to dive even deeper and uncover even more interesting information, make sure to check out our blog. We have a plethora of resources waiting for you! So, don’t wait any longer – explore more, level up your live chat metrics, and become a customer service expert. Your customers will thank you, and your business will thrive!
Share this article
Patricia has worked at LiveAgent for two years, leveraging her marketing background to create content. She specializes in articles, blogs, and guides on various topics, including customer service, help desk software, and customer communication. Her approach emphasizes making content not only informative, but also easy to understand, often sprinkling in a few tips to help readers transform theory into practice.
Patricia Krajcovicova
Copywriter and Content Specialist
Frequently asked questions
How can you calculate chats per hour?
To calculate chats per hour, divide the total number of chats by the number of hours. For example, if you've handled 120 chats in 4 hours, the calculation would be 120/4 = 30 chats per hour.
What is the difference between AHT and MTTR?
AHT (Average Handling Time) measures the average time it takes for an agent to handle a chat interaction, from the moment the chat starts to its resolution. MTTR (Mean Time to Resolution) measures the average time it takes to fully resolve a customer's issue, including any follow-up actions.
How many chats can an agent handle per hour?
The amount of chats an agent can handle per hour varies depending on several factors, such as the complexity of the inquiries, the agent's expertise, and the efficiency of the live chat platform. On average, an agent can handle 3-5 chats per hour. However, always prioritize quality over quantity to ensure that each customer receives the support they deserve.
12 Key Help Desk Metrics, KPIs, and How to Calculate Them
Explore 12 key help desk metrics and KPIs to enhance performance and customer satisfaction. Learn how to calculate and improve metrics like response efficiency,...
The top 16 customer service metrics to measure in 2025
Discover the top 16 customer service metrics to track in 2025, including CSAT, NPS, CES, and more. Enhance customer satisfaction, retention, and loyalty by meas...
21 min read
Customer Service Reporting
Customer Service Metrics
+3
Discover 23 must-know live chat statistics for 2025 revealing growth trends, customer preferences, and the impact on satisfaction and sales. Learn about chatbot...
14 min read
Live Chat
Statistics
+3
You will be in Good Hands!
Join our community of happy clients and provide excellent customer support with LiveAgent.