
Customer Engagement
Boost satisfaction, loyalty, and revenue with effective customer engagement strategies. Explore tips and tools for success!
7 min read
Customer support
Customer engagement
+1


Discover 12 essential customer engagement metrics for 2025, including conversion rate, NPS, and customer lifetime value. Learn how to effectively track and use these metrics to enhance customer satisfaction, retention, and loyalty, driving business success.
One of many things that sets a successful business apart from its competitors is the ability to effectively engage with its customers. Customer engagement is the driving force behind customer satisfaction, loyalty towards your brand, and an increase in sales and revenue. According to the PwC study, Up to 73% of customers say that experience is a crucial factor in their purchasing decisions. This also follows Microsoft research demonstrating that about 96% of customers agree that receiving excellent customer service plays a big role in their loyalty to a brand. So, the question is: How do you engage with your customers and what metrics should you pay attention to?
In this article, we will delve into the crucial aspects of customer engagement metrics. We’ll cover their importance, effective implementation in business strategies, and methods for tracking customer engagement. Additionally, we’ll explore the tools available for this purpose and examine how customer engagement relates to retention, acquisition, and loyalty. So, let’s get started!
Before diving deeper into the nitty gritty of customer engagement metrics, let’s establish what it means. Customer engagement refers to the level of involvement that customers have with a business that goes beyond just transactions. It’s all about building relationships.
Think about your past purchases. You were browsing on a website where a certain product caught your eye. You clicked on it and then a live chat window popped up where a customer service agent asked if you needed any help. Maybe they even provided a personalized recommendation based on your preferences.
If you have ever experienced something like this, then you came across a customer engagement firsthand! It’s the feeling of being seen, heard, and valued that results in you being more likely to make a purchase and become a returning and loyal customer.
So, now that we’ve defined customer engagement, let’s explore why it is so important for businesses to prioritize and measure it effectively.
Customer engagement is one of the most important aspects of a successful business. We all know that increasing sales is the ultimate goal, but by focusing on building meaningful relationships with your customers, you can position your brand for long-term success.
By engaging with them, you can create a unique experience that makes them feel valued and more connected to your brand. As a result, they will become returning and loyal customers who may even recommend your company to others – ultimately leading to increased sales.
It can also help you gather valuable feedback and insight that can help you make informed decisions, make improvements, tailor your products and services based on your target audience’s needs, create better marketing strategies, and stay ahead of the competition.
Now that we understand what it is and why it is important, we are going to explore 12 key metrics that can help with measuring customer engagement. These metrics are valuable indicators of the effectiveness of your customer engagement and the impact it has on your business. Tracking and analyzing them on a regular basis gives you the necessary insights into customer behavior, satisfaction levels, and their needs and preferences.
These are the metrics we will focus on:
The conversion rate is a key metric that measures the percentage of users completing a desired action. These actions can vary, including making a purchase, subscribing to a platform, signing up for a newsletter, registering for a free trial, clicking on an ad, or filling out a contact form.
How to track this metric
You can track this metric with the use of tools such as Google Analytics, which provides valuable data that can help you analyze the conversion rate for different customer touchpoints, marketing campaigns, and website interactions.
You can easily calculate it by dividing the total number of conversions by the total number of visitors and multiplying it by 100.
For example: If you had 50 conversions from 500 visitors, it would look like this:
(50 ÷ 500) x 100 = 10%
This would mean that your conversion rate is 10%.
Tips for implementing this metric
If you want to effectively implement and track your conversion rate, you can consider the following tips:
Tips to improve this metric
| Tip 1: Improve website user experience | Make sure that your website is well-optimized, user-friendly, easy to navigate, and visually appealing. Make it easy for customers to easily find the information they need and complete desired actions. |
|---|---|
| Tip 2: Personalize customer interactions | Personalize your messaging and offers based on the individual preferences and needs of your customers. By delivering tailored experiences, it will resonate more with your audience. |
| Tip 3: Streamline the conversion process | Remove any unnecessary steps that may hinder the conversion process. For example, you can reduce checkout steps or provide clear calls-to-action to make it easier for customers to convert. |
KPIs for this metric
Customer engagement KPIs you can track in relation to conversion rate include:
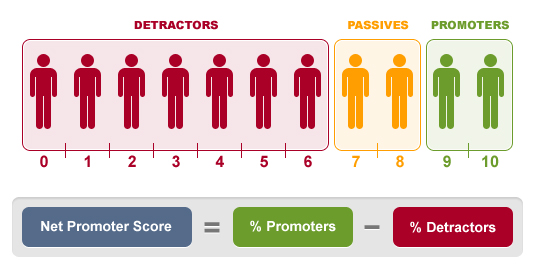
The Net Promoter Score (NPS) is a metric that measures customer loyalty and how likely they are to recommend your brand to others. The NPS is based on a simple feedback question: ‘On a scale of 0-10, how likely are you to recommend us to a friend or colleague?’
Based on their answer, they can be divided into detractors, passives, and promoters.
How to track this metric
To track the NPS, you can use different survey tools such as LiveAgent. These tools allow you to send out NPS surveys to your customers, collect their responses, and calculate the score. To gain a deeper understanding, you can include some open-ended questions to find out the reasons behind their rating: What was missing in your experience with us? How can we improve your experience?
Tips for implementing this metric
You can consider the following tips for the effective implementation of NPS:
Tips to improve this metric
| Tip 1: Provide outstanding customer service | Make customer service your top priority. Respond promptly to customer inquiries, offer helpful solutions, and go the extra mile to exceed their expectations. |
|---|---|
| Tip 2: Seek feedback at key touchpoints | Identify the most critical moments in the customer journey and ask for feedback at those times in order to make necessary improvements. These moments can be right after a purchase, support interaction, or product usage when the experience is still fresh on the customer’s mind. |
| Tip 3: Act on customer feedback | Don’t forget to use the feedback and insights that you gathered to take action and make necessary changes and adjustments. |
KPIs for this metric
Key performance indicators you can consider to track in relation to NPS include:
Pages per session measures the average number of pages a visitor clicks through during a single session on your website. It provides insights into the engagement level of your website visitors and the effectiveness of your content and navigation. When you have a high rate of pages per session, it generally means that your content is engaging and helpful. On the other hand, a low rate could be an indication of irrelevant content or poor structure.
How to track this metric
To track this metric, you can use analytics tools like Google Analytics, which provides this data as part of its standard reporting. You can implement a website visitor tracking code onto your website and monitor the number of pages that are visited by each user during their sessions.
Tips for implementing this metric
You can consider the following tips for the successful implementation of pages per session:
Tips to improve this metric
| Tip 1: Improve site speed | Pages that are loading slowly tend to have higher bounce rates and lower page views per session. To avoid that, you can optimize your website’s performance by minimizing large image sizes, enabling caching, or using a content delivery network (CDN) to enhance page loading times. |
|---|---|
| Tip 2: Internal linking strategy | Linking related content within your website not only improves the navigation but also encourages users to explore further. But, be careful not to overcrowd your content with too many links. Place them naturally throughout the text on your pages and choose relevant keywords for each link that will describe what the user can expect under the link. Otherwise, you’ll just confuse them, and they’ll end up leaving. |
KPIs for this metric
Key performance indicators you can track in relation to pages per session include:
The average session duration metric measures the amount of time a user spends on a website or app during a single session. It can help you identify which products, services, or content your audience is most interested in. Generally speaking, a higher average session duration is usually considered a good sign because it indicates that people are interested in your content.
How to track this metric
To track the average session duration, you can utilize website analytics tools that provide data on user behavior, session duration, and interactions on your website or app. By integrating your platform with these tools, you can gather the necessary data to calculate the average session duration.
Tips for implementing this metric
Tips to improve this metric
You can consider implementing some of these tips to increase the average session duration:
| Tip 1: Create high-quality content | Create relevant, informative, and engaging content that aligns with your target audience’s needs and interests. This will encourage users to spend more time exploring your website. |
|---|---|
| Tip 2: Improve website usability and user experience | Ensure your platform has an intuitive design and is easy to navigate. Providing a seamless user experience will encourage visitors to explore further and spend more time browsing through your pages. |
| Tip 3: Optimize page load times | Users are more likely to abandon slow-loading pages, which have a negative impact on the average session duration. Compress images, leverage caching, and minimize unnecessary scripts to optimize speed. |
| Tip 4: Use interactive content | Incorporate engaging features such as videos, quizzes, or other interactive tools that will keep your audience engaged, interested, and entertained. |
KPIs for this metric
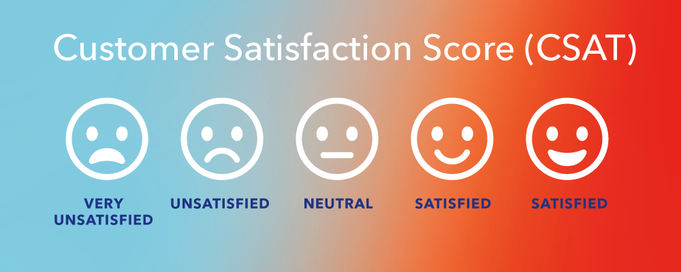
Customer satisfaction rating by channel helps you understand how satisfied your customers are across various communication channels, which channels they prefer to engage with your business, and which ones are not meeting their expectations or needs.
How to track this metric
To track and collect customer satisfaction ratings by channel, you can use surveys or feedback options that can be specific to each channel. There are various tools available for collecting customer feedback. One of them is LiveAgent which provides features that allow you to create these customized surveys, collect and analyze customer responses, and calculate satisfaction ratings for each channel.
A customer satisfaction score can be calculated by summing up all positive responses, dividing them by the total number of collected responses, and multiplying them by 100. The result gives you the percentage of satisfied customers.
For example, if you received 50 total responses and 20 of them were positive, your CSAT score would be calculated like this:
(20 positive responses / 50 total responses) x 100 = 40%
Tips for implementing this metric
Tips to improve this metric
If you want to keep improving your customer satisfaction ratings and delivering exceptional experiences on all communication platforms, you can consider following these tips:
| Tip 1: Provide customer support training | Ensure that your customer support team knows how to handle inquiries and provide prompt and relevant responses across all channels. Consistency in service quality is crucial for customer satisfaction. |
|---|---|
| Tip 2: Optimize response times | Try to provide fast response times on all channels, regardless of the volume of customer inquiries. You can implement tools like live chat, chatbots, or ticketing software to streamline response times and minimize customer wait times. |
| Tip 3: Personalize experiences | Try to personalize each interaction and communication based on the preferences and behaviors of individual customers. This level of personalization makes customers feel valued and enhances their overall satisfaction. |
KPIs for this metric
Additional KPIs you can track when measuring customer satisfaction ratings by channels:
Customer Lifetime Value (CLV) is a metric that can calculate the total revenue a company can generate from a single customer over the course of their relationship. It helps determine which customer groups are the most valuable to make informed decisions regarding customer acquisition, retention, and upselling strategies. By increasing customer engagement and customer satisfaction, you can positively influence lifetime value by providing great customer service, which reduces the risk of customer churn.
How to track this metric
To track CLV, you need to analyze past sales data, customer behavior, and revenue generated over a specific period of time. Using customer relationship management (CRM) platforms can help gather and organize this data easily. By segmenting your customers, calculating how much they spend on average per transaction, and multiplying it by the average number of transactions per year, you can estimate your CLV.
Tips for implementing this metric
Tips to improve this metric
To improve CLV, you need to be able to build stronger relationships, increase customer loyalty, and encourage repeat purchases. Here are some tips that can help you with that:
| Tip 1: Focus on improving customer experience | When you start focusing on providing exceptional customer service, personalized recommendations, and prompt support, it will have a positive impact on customer experience, as well as the likelihood of repeat purchases. |
|---|---|
| Tip 2: Offer loyalty programs and incentives | Implement loyalty programs, special offers, discounts, and loyalty points to reward customers who continue to support your business. |
| Tip 3: Upsell and cross-sell | By analyzing customers’ purchase history, you can identify opportunities to upsell and cross-sell relevant products/services based on their preferences. You can also recommend add-ons or higher-tier options that will align with their needs. |
KPIs for this metric
Here are some additional key performance indicators you can track in relation to CLV:
Customer retention rate is a metric that measures the ability to turn customers into repeat buyers and prevent them from churning. It shows you the percentage of customers your company retains over a specific period of time. It’s important to track this metric in order to see the efficiency of your marketing strategies. A high retention rate is a strong indicator of customer loyalty and overall business success.
How to track this metric
To track your retention rate, you need to gather data on customer churn and the total number of customers at the beginning and at the end of a specific time frame. You can use customer relationship management (CRM) tools to track customer interactions, analyze churn, and calculate customer retention rates.
To calculate the customer retention rate, divide the number of customers at the end of the period by the number of customers at the beginning of the period, and multiply the result by 100 to get the retention rate percentage.
Tips for implementing this metric
Tips to improve this metric
You can consider these few tips to exceed customer expectations and improve your customer retention rate:
| Tip 1: Provide exceptional customer service | Offer prompt and personalized customer support, actively listen to customer needs, and go above and beyond to resolve any issues they may have. By providing exceptional customer service you can build strong relationships and increase customer loyalty. |
|---|---|
| Tip 2: Offer loyalty incentives | Reward your returning customers with loyalty programs, discounts, rewards, or exclusive offers to motivate them to continue doing business with you, and foster a long-term relationship and engagement. |
| Tip 3: Act on customer feedback | Regularly gather feedback from your customers to understand their satisfaction levels and identify areas that need improvement. But don’t just gather the feedback; make sure to use it to make necessary enhancements to your products or services to show them that their opinions matter to you. |
KPIs for this metric
Key performance indicators related to customer retention rate include:
The churn rate, also known as the customer attrition rate, is the percentage of customers who have stopped doing business with your company during a specific time period. It provides insights into customer retention and the effectiveness of your strategies.
How to track this metric
You can use analytics tools and CRM software to track this metric, analyze customer activity, and calculate the churn rate over a specific period. Depending on the type of company, the churn rate can be monitored weekly, monthly, quarterly, or annually. For example, SaaS companies tend to have a customer base that fluctuates quite rapidly, which means that it would be a good idea to monitor the churn rate more frequently.
To calculate the churn rate you need to divide the number of customers you lost during a specific time period by the number of customers you had at the beginning of that time period and multiply it by 100.
For example:
(20 / 500) x 100 = 4%
This shows you that your customer churn rate over the chosen period of time is 4%.
Tips for implementing this metric
Tips to improve this metric
Reducing churn should be a key goal for every business. Here are some tips to help you accomplish that:
| Tip 1: Simplify the onboarding process | Educate your new customers about your product or service, offer knowledge resources, and address any concerns or questions they may have. A smooth onboarding process plays a vital role in client acquisition, making a positive first impression. |
|---|---|
| Tip 2: Provide personalized service | Communicate with your customers through personalized interactions. This can include proactive outreach, personalized offers, or targeted content that caters to their specific needs. Addressing their individual needs can enhance customer loyalty and reduce churn. |
| Tip 3: Focus on customer feedback | Actively seek feedback from your customers to give them the opportunity to express their thoughts and what they like or don’t like about your products/services. This will allow you to address any issues before they churn and it also shows them that their opinions matter. |
KPIs for this metric
Tracking the ticket volume by support channel will help you understand how customer support requests are distributed across different channels, and which ones have the highest customer engagement. With this data, you can plan and create your marketing campaigns based on the communication channel.
Keep in mind that these preferences can also differ based on the customer segment. For example, younger customers may prefer to communicate with chatbots, while older customers may prefer to call and speak to your customer service representatives directly.
How to track this metric
To track ticket volume by support channel, you can use customer service software such as LiveAgent. It provides comprehensive ticket management capabilities that allow you to organize and categorize support tickets based on the channel they came from. LiveAgent also provides reporting features that break down ticket volume by channel, providing you with valuable insights.
Tips for implementing this metric
Here are a few tips for Implementing the tracking of ticket volume by support channel:
Tips to improve this metric
| Tip 1: Provide self-service options | Create and promote self-service resources, such as knowledge bases, video tutorials, or community forums to encourage customers to find answers themselves – reducing the ticket volume across all support channels. You can easily do so by using LiveAgent which allows you to create amazing knowledge bases and FAQs easily. |
|---|---|
| Tip 2: Implement automation | LiveAgent also provides automation features such as ticket routing or canned responses that streamline repetitive tasks, saving time for both customers and support agents. |
| Tip 3: Provide proactive support | By providing proactive support, businesses can identify potential issues before they become tickets and therefore reduce the ticket volume. |
KPIs for this metric
The Customer Effort Score (CES) measures how much effort your customers put into interacting with your business and how easy or difficult it is to come to a resolution.
How to track this metric
To track the CES, you can design a survey and ask customers to rate their customer service experience – typically on a scale from 1 to 5.
![Image of CES survey 'How easy did [organization] make it for you to solve your issue?' scaled from 1 (extremely difficult) to 5 (extremely easy)](https://images.liveagent.com/images/processed/blog/ces-survey-example.png)
You can calculate your CES through a simple formula:
CES = Sum of customer effort ratings / Total number of survey responses
The result will give you a number of the average effort your customers need to put in during the interaction with your business.
Tips for implementing this metric
Tips to improve this metric
Improving your CES involves streamlining processes and creating a smooth and effortless customer experience. You can consider these tips:
| Tip 1: Provide self-service options | Offer self-service resources to empower customers to find answers and resolve issues on their own without the need to contact your customer support. Make these resources easily accessible and intuitive to use. |
|---|---|
| Tip 2: Simplify processes | Evaluate your customer journey and identify areas where unnecessary steps can be eliminated. |
| Tip 3: Proactive communication | Be proactive in your communication. Provide clear instructions, set accurate expectations, and stay in touch throughout the customer journey to minimize customer effort. |
KPIs for this metric
The DAU metric is used to measure the number of unique users who engage with your product or service on a daily basis. It provides insights into the level of customer engagement and the frequency at which customers are interacting with your company.
How to track this metric
You can utilize analytics tools such as Google Analytics to monitor user activity, track unique daily visitors, and analyze engagement patterns over time.
If you want to also calculate your total daily active users over a certain time period, you can use the following formula:
Unique new users + Unique returning users = total DAU
Tips for implementing this metric
Consider the following tips for the successful implementation of the DAU metric:
Tips to improve this metric
| Tip 1: Enhance user experience | Continuously focus on improving the usability and user experience of your product or service. Aim for intuitive navigation, clear instructions, and a visually appealing interface to keep users engaged. |
|---|---|
| Tip 2: Offer new updates | Regularly introduce new features and updates that bring value to your users. Listen to their feedback to ensure you’re meeting their needs and encourage them to come back. |
| Tip 3: Personalize user interactions | Use the collected data to provide personalized experiences; tailor your content and recommendations based on individual preferences and behavior, making your customers feel valued. |
KPIs for this metric
Organic clicks refer to the number of clicks a website receives from search engine result pages (SERPs) without any paid advertising. These clicks are generated when users find and click on a website in organic search results, often due to its relevance and high ranking within the search engine’s algorithm. It is an important metric that indicates the visibility and effectiveness of your website in attracting organic traffic.
How to track this metric
To track your organic clicks, you can use tools such as Google Analytics or SEO platforms like SEMrush, or Ahrefs. These tools provide insights into how many visitors clicked on your website’s organic search listings and the specific search queries that led to those clicks.
Tips for implementing this metric
Tips to improve this metric
| Tip 1: Optimize your meta titles and descriptions | Create descriptive titles and meta descriptions that entice users to click on your links organically. Use keywords naturally and make sure your titles and descriptions accurately reflect the content of your pages. |
|---|---|
| Tip 2: Create high-quality content | Produce relevant, informative, and engaging content that answers users’ search queries. By doing so, you can increase the likelihood of attracting more organic traffic. |
| Tip 3: Optimize website loading speed | Faster loading speeds can lead to improved user experience and higher organic click-through rates. You can do that by compressing the sizes of your images and videos or using caching techniques. |
KPIs for this metric
Customer engagement is deeply intertwined with other key business metrics. This is due to the fact that when businesses actively engage with their customers, it has a ripple effect on various aspects of their operations. So let’s explore how customer engagement impacts other metrics:
I’m sure we can all agree that acquiring new customers is one of the top priorities for every business. So, what role does customer engagement play in this process?
Here’s an example:
Let’s say you’re a small business owner running an online store. You decided that your marketing strategy will be to focus on engaging with your customers through personalized social media interactions, and by offering tips and tricks on how to use your products properly.
One day a customer finds your page on a social media platform, starts to follow your account, and engages by commenting and liking your social media posts. As a part of your customer engagement strategy, you reply to their comments and thank them for their support. Because of this, the customer starts to develop a sense of connection with your business. After some time, the customer finds a product they fall in love with and decides to purchase it. After receiving the product, they post it on their social media and tag your online store.
Their followers start to ask more about your business and start expressing their interest in making a purchase as well. Thanks to the engagement of the customer and your responsiveness, you not only acquired one new customer, but you also attracted new customers who came directly from their recommendation. By nurturing customer engagement, you were able to create a network of loyal customers who actively promote your brand, thereby driving customer acquisition and expanding your customer base.
If you want to retain your existing customers, you need to build a long-term relationship with them that is based on loyalty and trust. By actively engaging with your customers, you create a positive experience and make them feel valued, which gives them reasons to stay instead of opting for one of your competitors.
Let’s look at a real-life example:
You are running an online subscription-based service that offers meal kits delivered right to customers’ doorstep. One of your customers signed up for a trial period a few months ago but was never fully engaged with your brand. They received their meals, but there was a lack of communication, no personalized recommendations, and limited opportunities for feedback from your side. Because of this, the customer started to consider canceling their subscription.
However, you decided to change your strategy and start actively engaging with your customers. You started offering personalized recommendations based on dietary preferences, regularly communicating about upcoming menu options, and encouraging your customers to leave feedback.
Suddenly, the customer who was considering leaving started to engage and left their feedback; they expressed what they liked and didn’t like, which gave you the opportunity to make changes and improve their experience even more. Because of this level of engagement, they changed their mind completely and you were able to retain the customer.
If you want to build a loyal customer base, customer engagement is the way to go. So, why is customer engagement so important for a brand? Simply put, by engaging with customers, they develop a sense of emotional connection and trust that goes beyond transactional interactions. This creates a strong bond between the customer and the brand, leading to increased loyalty and repeat business.
To illustrate this, imagine a simple scenario:
There is a small local bakery that makes homemade pastries, cakes, fresh bread, and all kinds of tasty treats. They have a few loyal customers who have been visiting their bakery on a regular basis for years. So, what sets this bakery apart from others and makes its customers come back?
The bakery strongly focuses on customer engagement. Whenever their loyal customers come to the bakery, the staff greets them by their name and remembers their favorite products. They also make personalized recommendations based on their previous purchases. But that is not all. The bakery goes one step further by organizing special workshops and events where the customers can learn how to make certain treats and engage with the employees on a more personal level.
This is the level of customer engagement that makes their customers feel valued and appreciated. The bakery was able to build a bond with customers and create a sense of community. As a result, these loyal customers also became advocates, recommending the bakery to their friends and family.
Throughout this blog post, we explored what customer engagement means and emphasized the importance of creating meaningful connections and interactions with customers. We also went over various customer engagement metrics, such as conversion rate, net promoter score, customer satisfaction rating by channel, customer lifetime value, and many others. These metrics provide valuable insights into the effectiveness of your engagement strategies, allow you to make data-driven decisions to optimize customer experiences, and improve customer relationships.
Furthermore, we explored the relationship between customer engagement and other key business metrics, such as customer acquisition, retention, and customer loyalty. By actively engaging with customers, businesses can not only attract new customers through word-of-mouth recommendations but also increase retention rates by fostering loyalty and trust.
So, if you are ready to take your customer engagement to the next level, consider giving LiveAgent a try! You can sign up for the 30-day free trial and experience all the features necessary to improve customer interactions and drive your business growth.
Share this article
Patricia has worked at LiveAgent for two years, leveraging her marketing background to create content. She specializes in articles, blogs, and guides on various topics, including customer service, help desk software, and customer communication. Her approach emphasizes making content not only informative, but also easy to understand, often sprinkling in a few tips to help readers transform theory into practice.

No, customer engagement metrics measure the level of involvement and interaction that customers have with a brand. The customer retention metrics track the ability of a company to retain and keep its existing customers over a specific period of time.
AI and machine learning enable personalized and efficient interactions through AI-powered chatbots and virtual assistants that can provide instant responses to customer inquiries. Machine learning algorithms can analyze customer data to deliver personalized recommendations and targeted marketing campaigns.
The frequency of reassessing your customer engagement strategy can vary depending on your industry, business goals, and customer behavior. However, it's generally recommended to monitor and evaluate your customer engagement metrics at least on a quarterly basis, to identify trends, measure the effectiveness of your strategies, and make necessary adjustments.
B2B often involves more complex decision-making processes and a focus on building relationships and trust. B2B customer engagement metrics may include metrics related to lead generation, account growth, customer satisfaction, and the overall success of client partnerships. B2C customer engagement metrics may prioritize metrics such as purchase frequency, customer satisfaction, social media engagement, and brand loyalty.
Data privacy laws, such as the General Data Protection Regulation (GDPR) in Europe and the California Consumer Privacy Act (CCPA) in the United States, have a significant impact on customer engagement metrics. These laws impose stricter regulations on how businesses collect, use, and store customer data. As a result, companies must ensure compliance with data privacy laws, which can affect their ability to track and analyze certain marketing engagement metrics.
Boost satisfaction, loyalty, and revenue with effective customer engagement strategies. Explore tips and tools for success!
Discover how exceptional customer care builds loyalty, emotional connections, and brand trust. Learn strategies, benefits, and best practices now!

Master customer retention with 13 proven strategies, key metrics, and real examples. Boost loyalty, profits, and brand reputation today!
Join our community of happy clients and provide excellent customer support with LiveAgent.